


Event organiser Informa Connect has hailed the impressive success of Tissue World Miami 2024 after recording visitor growth up 61% compared with 2022’s exhibition.
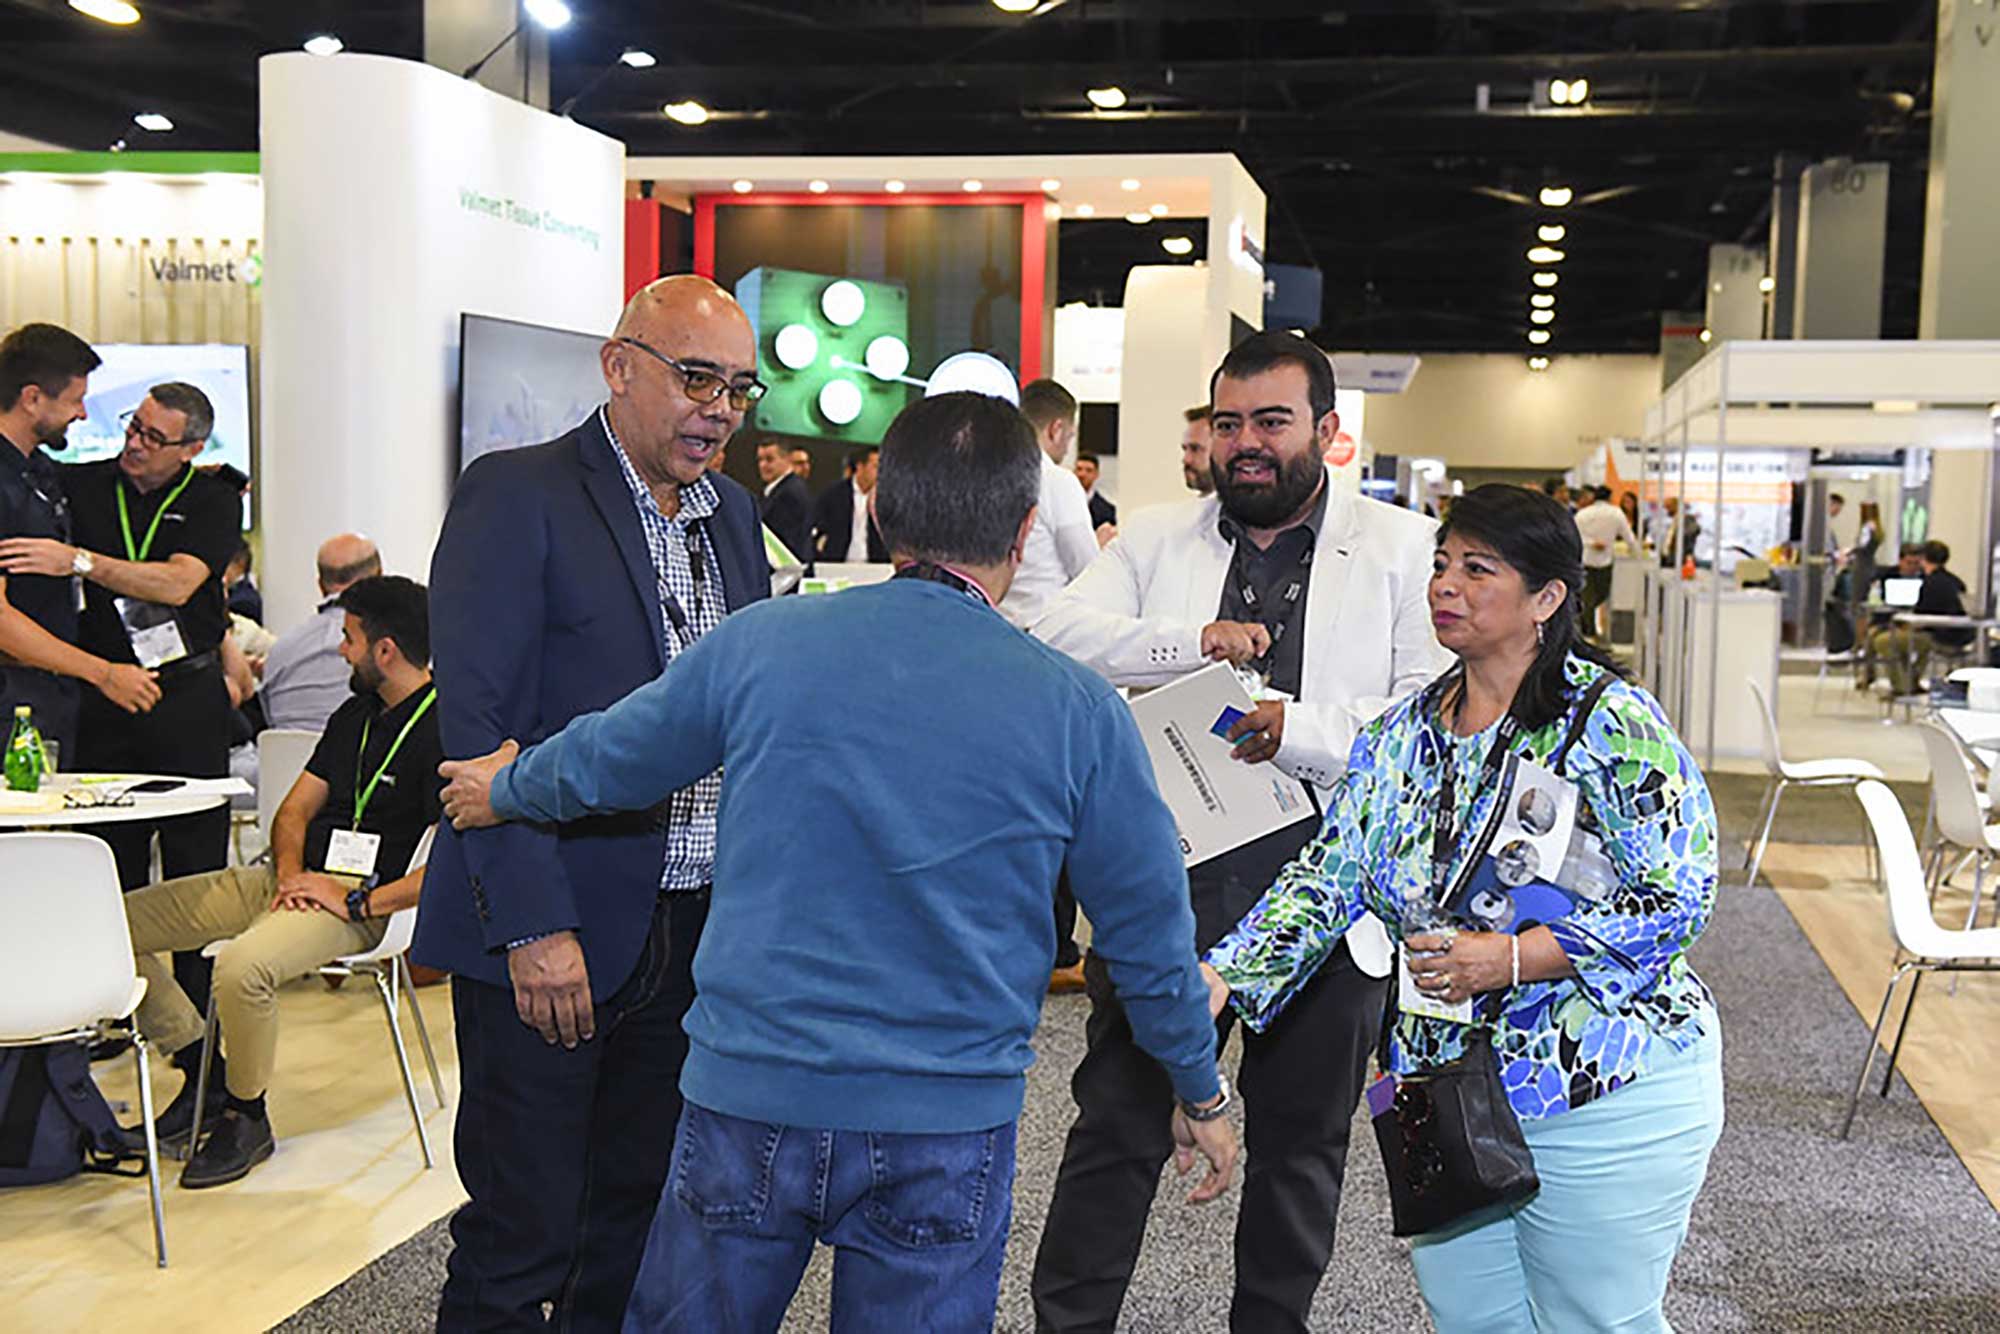
North America’s largest tissue exhibition and conference saw over 1,862 visitors from 86 countries attending, taking time to talk to customers, peers, meeting old friends and making new.
The floorplan saw growth of 30% with 135 exhibitors showcasing the very latest technologies – from paper machinery through to converting, packaging, chemicals, and AI – generating 2,629 leads during the three-day event.
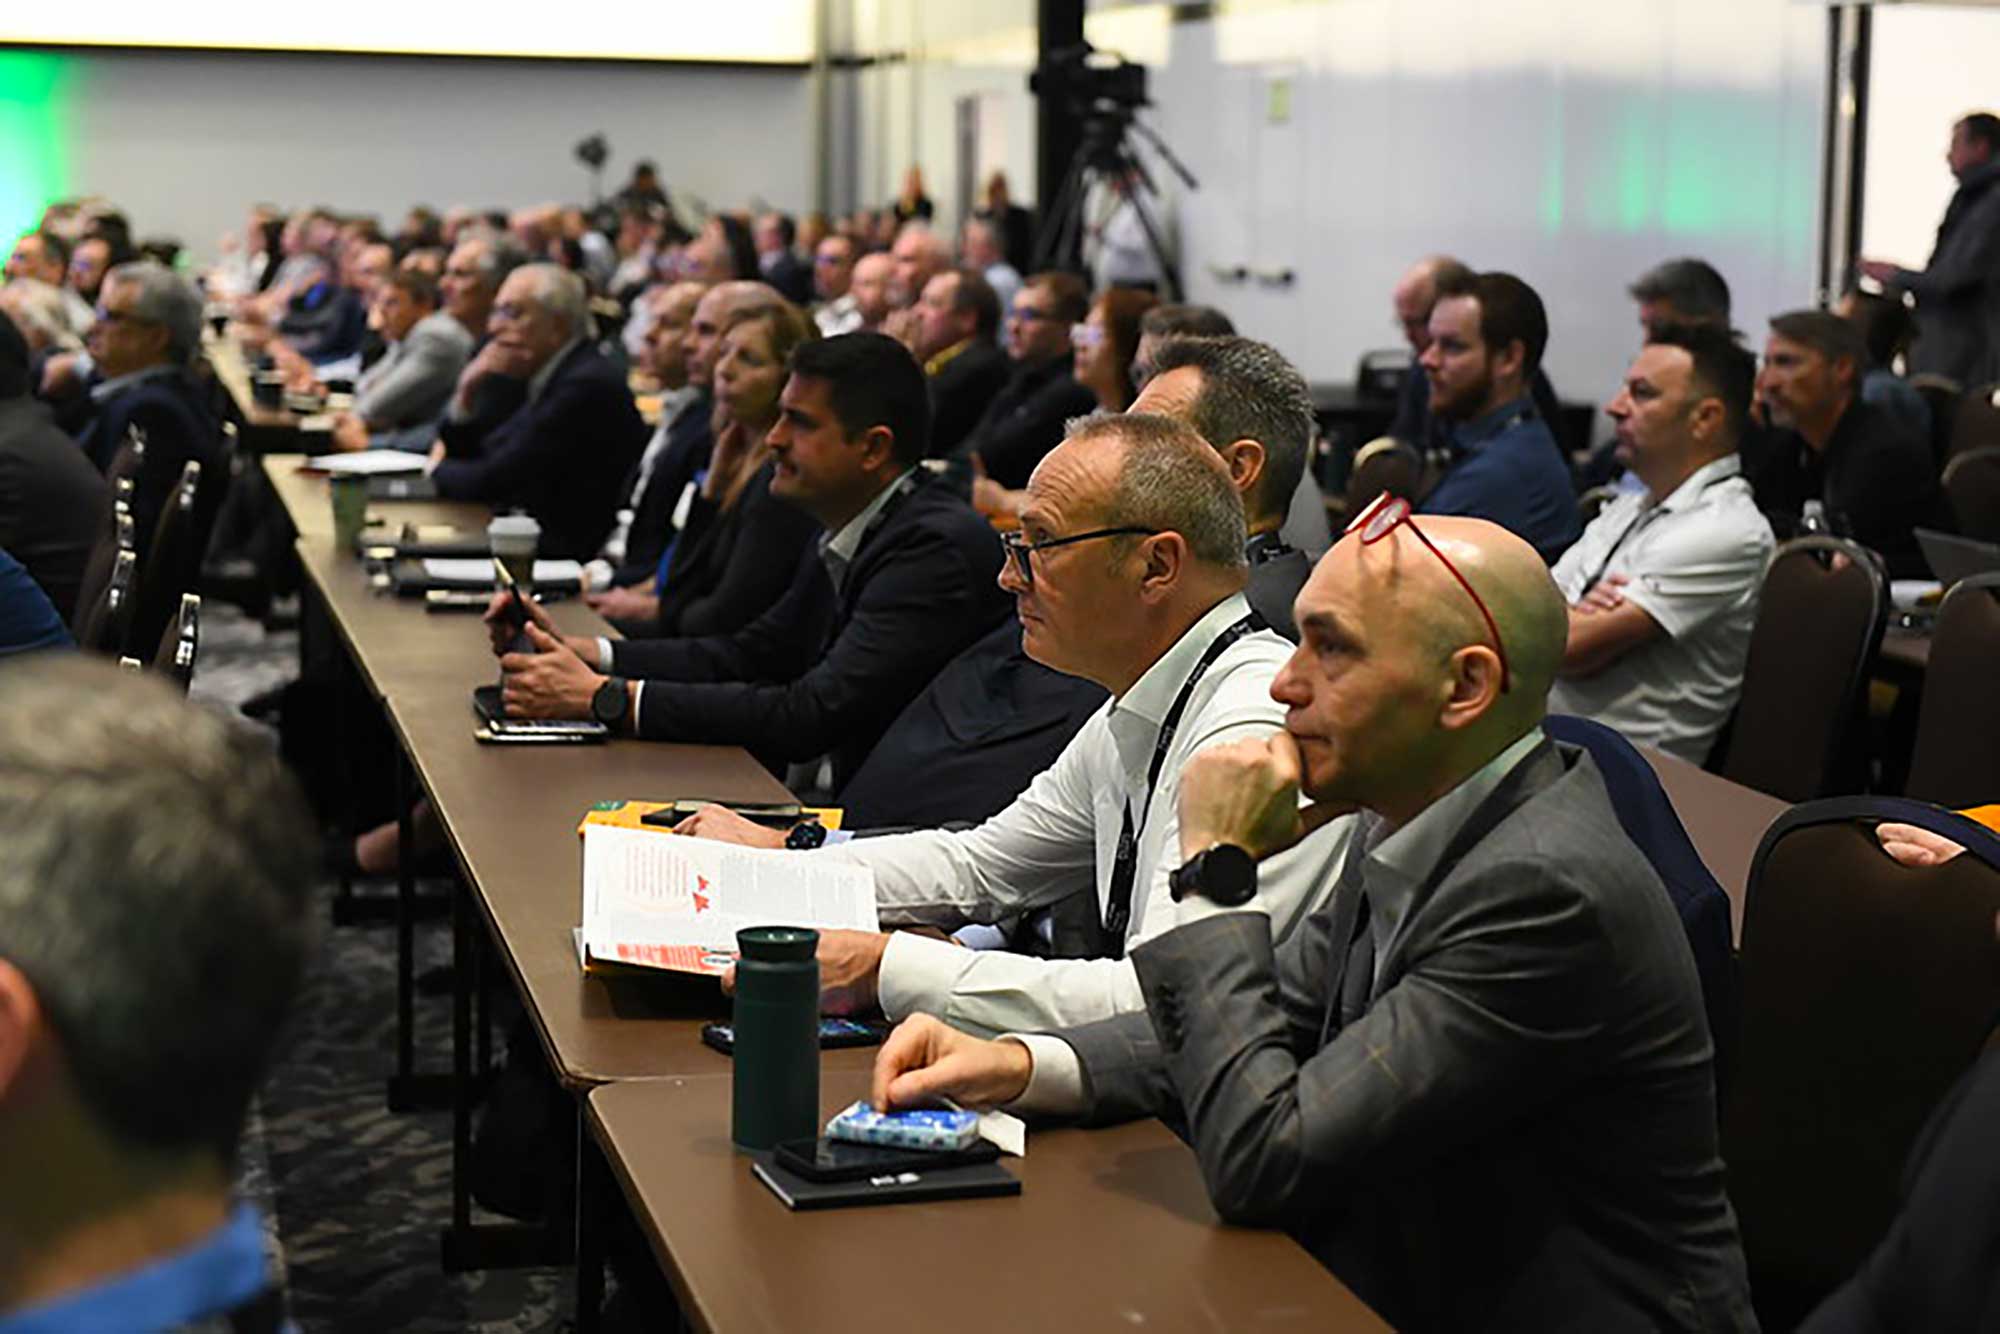
Hundreds of delegates also attended the conference – themed All to Play for in a VUCA World: Strategies for Winning with Tissue – which offered insights via deep-dive talks and Q&A sessions from 50+ speakers, including keynote speaker Jean-David Tardif, President and Chief Operating Officer of Cascades.
Fabio Perini, Italian entrepreneur and tissue technology visionary, also heralded a first for Tissue World by delivering a pre-recorded keynote address and Q&A session that was presented live at the Miami conference.
A new addition to the conference was the Tissue Workshop, where participants collaboratively designed a sustainable blueprint for the future of the industry.
Visitors to the exhibition also attended Tech Talks, featuring 15-minute sessions on the latest trends and technologies in tissue manufacturing.
Topics include maintenance practices, converting design considerations, creping technology, and more.
And on Day Zero, to welcome the start of the exhibition in true Tissue World Miami style, the networking drinks reception – held at the Clevelander Hotel’s iconic rooftop bar – was the busiest seen in years.
For those who couldn’t attend, below TWM summarises some of the key talks and themes from the conference.
Clean Living, how Sofidel America works to meet market challenges
and customer needs
Derek Dafoe, Executive Vice President, Marketing & Sales USA, Sofidel America
“Sofidel is committed to continued growth and expansion that will result in the doubling of our volume within the next decade.”
Entering North America – understanding the marketplace and creating a map to success.
Accomplishments to date – update on where we are 11 years later.
Vision for the future – where does Sofidel see the North American market in 10 years.
Points of Difference in a commodity driven future – how will Sofidel drive future growth.
The factor’s driving Sofidel’s growth
Asset Quality – Sofidel is committed to ongoing investment to provide newer and better performing production plants than the industry average.
Geographical Coverage and Proximity – with the presence of plants closer to the end user we focus on efficient supply chain management.
Sustainability – as part of Sofidel’s social-cultural efforts and competitive growth strategy we are committed to helping people and the planet.
Digitalisation – with increasing attention paid by Sofidel to the impact of ongoing digital transformation, from operational processes to logistics, the customer experience, and cyber security.
As of 2022 Sofidel was the sixth largest global producer of tissue products, with operations in North America & Europe. Sofidel is 100% focused on the production of tissue. Where others have diversified, Sofidel has focused. Manufacturing in 13 Countries across two continents.
Coming to America – 2012
The North American market has lagged global developments, this has resulted in a lack of new tissue assets and the ageing of existing tissue assets.
Sofidel believed that by investing in new tissue technology and assets we would enable the company to compete successfully in terms of cost structures, production efficiency and organizational flexibility.
Building on our heritage we believe that the North American private label market is underdeveloped and will grow at an accelerated pace moving forward.
New technology for paper mills
Sofidel is focused on acquiring new generation machines for producing paper tissue, the latest being installed in Sofidel Poland, Sofidel Spain and in Sofidel America. With these machines Advantage New Tissue Technology (NTT) 200 made by Valmet, Sofidel can now produce textured paper and further raise the quality of its product line, whilst improving the energy efficiency of the production sites.
New technology for converting lines
Sofidel is also focused on acquiring new state of the art converting assets, most recently the new Constellation Technology made by Fabio Perini which guarantees uniform rolling of any type of paper, from the first to the last sheet, that will be installed in 23 converting lines. The result is a high performing converting process, which is a key factor of Sofidel’s growth strategy.
Smart store: new warehouse technology
Moving forward with automation and robotics.
Sofidel has implemented:
system of automatic reel transfer between the paper mill and converting stages
through laser-guided vehicles (LGVs)
the complete automation of finished product management thanks to the automatic Smart Store warehouse, capable of handling tens of thousands of pallets in an area with 14% oxygen (to prevent fire risks) and saving 40% space.
This is in place in Sweden, Poland, and America.
Private label: how we differ from others
Private Label represents about 70% of market share in Western Europe while in the United States, private label is less developed accounting for approximately 30% of the market share.
Sofidel is establishing new production plants with a national footprint to service the needs of today’s retailers.
New and innovative product capabilities: i.e., NTT & updated Converting Assets.
Flexible Innovation with a willingness to do different things and offer solutions to a changing market.
Sustainability: as a strategic factor and core strength.
Optimising our North American footprint
Sofidel is committed to expanding our manufacturing footprint to allow us to meet the needs of our National and Regional customers. Our focus is to locate our facilities where the market is and optimise our supply chain and transportation costs to better support our customers’ needs. We believe that this strategy will allow for a continued growth model that offers strategic benefits beyond many of our regionally based competitors.
Most recently, in 2018 our State-of-the-Art Greenfield facility in Circleville, Ohio, began operations. This facility is built to support Sofidel’s environmental focus with new state of the art paper making and converting assets. Total annual capacity increases by over 140,000 metric tons.
In 2020, our second State-of-the-Art Greenfield facility in Inola, Oklahoma, begins operations, allowing Sofidel to move forward in our goal to become a national supplier and to provide another 140,000+ metric tons of capacity.
In 2023, we announced the acquisition of a third Paper Machine to be located in our Circleville, Ohio facility. This will increase capacity by an additional 77,000 metric tons per year beginning in 2025. Also in 2023, we finalised the acquisition of the paper machine and facility in Duluth, Minnesota, adding 70,000 metric tons to meet our immediate needs.
2024+ Sofidel is committed to additional investment in our North American business filling out our vision to be a coast-to-coast supplier of high quality, sustainably manufactured products.
Sofidel America has now become the largest operating division of Sofidel Group representing over 26% of overall group revenue. As of 2022:
United States – 26.7%, UK – 13.5%, Italy – 12.1%, Germany – 9.5%, France – 8.8%, Poland – 6.3%, Spain – 4.7%, Ireland – 2.6%, Belgium – 2.5%, Romania – 2%, Others – 11.4%.
Sofidel’s asset base is one of
the newest in North America
According to AFRY, because of the aggressive growth and investments in the tissue sector in emerging markets, North American tissue assets have become old (26 years on average on technical age) in comparison to what is found in other regions (the average tissue machine technical age globally is at 15 years; while only eight years in China. The investments Sofidel has made have positioned us with newer, more efficient assets than the base of our North American competition.
New technology, combining increased efficiencies and upgraded performance allows Sofidel to drive growth
Volume breakdown by line of business:
Total 2022: Private label – 62%, Brand – 12.9%, AfH – 14.60%, Jumbo Reel – 9.80%, Contract – 0.80%.
USA 2022: Private Label – 62.4%, Jumbo Reels – 5.9%, AfH – 28.6%, Contract – 3.1%, Brand – 0.0%.
Sofidel is committed to continued growth and expansion that will result in the doubling of our volume within the next decade.
Sofidel Strategic Pillars:
Investment
Over $1B invested since 2017 (more coming)
National footprint enables more economical freight
Asset age among lowest in US market
Innovation
Unique value-added products to drive differentiation for distributors and end users
Flexible organisation enables quick responds to needs
Sustainability
1. Cost Reduction
2. Motivating Personnel
3. Public Support
4. Higher Market Standards
5. Consumer Satisfaction
6. Responding to Customers
7. Anticipating Regulation
8. Increased Credibility & Trust
9. Access to Capital
10. Enhanced Reputation
Committed to growth
Investing in state-of-the-art equipment that uses the latest energy and performance technology.
Geography, reducing transportation costs by locating our operations within 500 miles of our customer base.
Sustainability, everything we do is focused on delivering value that leaves the world in a better place.
Challenge, we challenge the status quo, partnering with customers to drive strategic engagement.
Focus, we are a tissue company, we are not distracted by other industries.
Family, we are family owned with a commitment to mid to long term results.
Envisioning carbon-free tissue production
Bruce W. Janda, Senior Business Information Consultant, ResourceWise
The tissue-making process is one of the most energy-intensive papermaking processes, accounting for only 9% of global paper production tons but 14% of total scope 1 and 2 yearly carbon emissions on the machine. Tissue machines run the fastest with the lowest basis weight on generally narrow machines compared to the high-volume Packaging and Communications grades. Global tissue machines have the highest average emission of any pulp and paper process at 0.984 tons of CO2 per ton of finished tissue production (machine energy only).
Tissue manufacturers have increasingly focused on strategies for reducing or offsetting carbon emissions in part due to the high visibility and consumer engagement with tissue products. Low or carbon-free drying equipment is available, and several tissue machines are running or planned as demonstration projects.
This report will look at the scope and variability of tissue machine production using the ResourceWise FisherSolve Next system to identify some of the critical steps required to reduce the carbon footprint of tissue products. Beyond using all renewable or noncarbon power and fuel for tissue machine operation, there are also opportunities for the tissue industry to make significant carbon emission reductions through process efficiency improvement and waste reduction. A deep dive into the United States’ tissue industry and the planned hydrogen hubs will identify opportunities and risks.
Overview of current
industry carbon emissions
Definitions of Scope 1, 2, and 3 Emissions:
Scope 1: Covers direct emissions from sources that an organization owns or directly controls. These include on-site fuels such as Boiler – Steam for Yankee, Yankee Hood Burners, and CoGen Turbines.
Scope 2: Emissions that company causes indirectly and come from where the energy it purchases and uses is produced. Off-site emissions from electric power grid and other power supplies.
Scope 3: Encompasses emissions that are not produced by the company itself and are not the result of activities from assets owned or controlled by them. Instead, those up and down the value chain are responsible for these emissions. These include all sources not within the scope 1 and 2 boundaries, such as fiber sources, supply chain, transportation, and use and disposal.
Pulp and paper is not the big industrial problem! Tissue makes up only 14% of the global industry – but customers are very emotionally engaged. All industries discharged about 30% of total greenhouse gas emissions in 2021.
Focus on machine operations
Tissue Machine CO2 Emissions: Scope 1 & 2 only (fuel and electric power)
Total emissions per year:
China and US make the most tissue and CO2 per country
EU would make list too if a country
Total emissions per ton of tissue – coal power grids and site fuels
1. South Africa
2. Serbia
3. Zimbabwe
4. Australia
5. Poland
Global tissue machine CO2 emission/FMT
There are thousands of global tissue machines, and huge opportunities for improvement. Integrated sites are more efficient.
Where are the lowest and highest carbon-emitting machines? Lowest Emitting Machines by Region: Sweden – Brazil – Indonesia.
Highest emitting machines by region: Australia – United States – China.
Essity’s Lilla Edet mill now produces tissue with zero fossil fuel emissions. Essity cissue’s transition to carbon-free production on an older three-machine tissue mill using 100% recycled furnish included:
In 2021, new biomass boiler uses renewable fuels, such as wood chips and bark, to generate heat and electricity.
In 2022, biogas is used to power the mill.
In 2022, new heat recovery system captures waste heat from the drying process and uses it to heat other parts of the mill.
Eliminating Scope 1 emissions with hydrogen fuel: 2021 pilot trial at Essity’s Mainz-Kostheim plant in Germany. This included recycled integrated fibre to produce commercial tissue products on three newer or medium-age tissue machines. Already some biogas for boiler and power. Hydrogen used for hood gas (600º C). Not claimed to be economically viable.
Source: www.essity.com
Decarbonisation
opportunities and concerns
Site location is a major factor in mill carbon content.
Scope 1: Fuel Used On-Site – California gas fuel includes electric power.
Scope 2: Purchased Power – Utah, Missouri, Kentucky, Wisconsin use coal power. Canada and North West US use waterpower.
Fuel intensity GJ generally correlates to carbon intensity
Advanced Tissue Technology (TAD) has higher carbon and fuel intensity
Integrated fibre sites have lower carbon intensity/per power intensity
Virgin fibre integrated sites have lower carbon intensity
Scope 2 North American tissue machines: purchased electricity
Carbon Emissions/FMT and GJ Fuel/FMT
Power Intensity GJ generally correlates to Carbon Intensity
Advanced Tissue Technology (TAD) has higher power and fuel intensity
High cost of vacuum dewatering and fan for air drying vs. pressing
Reduced purchased power for machines at virgin integrated sites
Scope 1: On-site Fuel for Steam and Hot Air: Hydrogen, Mixed Gas, or Ammonia Fuel Replacement?
Hydrogen Costs Projected by US DOE:
Current NA Average Site Fuel = 13.123 GJ/FMT
Natural Gas = $5.12/GJ
Current Natural Gas Avg Cost/Mill = $67.18/FMT
Hydrogen = 0.141878GJ/Kg
Hydrogen @ $1/Kg = $92.49/FMT
Hydrogen@ $7/Kg = $647.46/FMT
Scope 2: electric grid decarbonisation – increased costs and variability risk as coal shuts down? Power storage on-site? Cost to prepare for renewable power – renewables have a daily cycle that makes the base load plants uneconomical. Power Storage is required to use renewables economically, but battery storage has to go somewhere. More renewables are needed to replace base load systems and this adds to the total costs and risks. Power storage on the tissue mill site?
The California “Duck Curve” shows the net base load demand shifts when renewable solar power takes over. Existing base load systems become uneconomical and shutdown due to low run times.
Battery prices continue to fall with new technologies and capacity. These costs may be doable for tissue mills. On-site storage will be a “thing” for homes, businesses, and mills with increased renewable power. What would be the cost of a mill-based system? How many hours are required to ensure profitability?
What is possible now?
North American tissue machine technical age vs. Scope 1 and 2 Carbon
Blue circles are Advanced Technology (mostly TAD) and show higher carbon emissions per ton
Orange circles are Conventional Wet-pressed Technology
Circle size is tons/year for each tissue machine
Trend lines show improved carbon emissions per ton with newer machines
Advanced Technology carbon emissions are improving caster than Conventional Machines.
Process equipment upgrades can reduce carbon intensity
Examples of the North American machine dataset filtered by technology and equipment type:
Shoe Press has better results than Roll Press
Less drying energy
Increased Production Rate
Headbox Dilution vs. Headbox Slice Control shows dilution capabilities to fix CD grammage
Steel Yankee 8-10% increased production rate or reduced energy – found on newer machines.
The basics of tissue making: managing variability and waste
Low converting efficiency (40-70%) is partially attributed to MD/CD profiles
Base sheet variability follows Weibull distribution
Don’t let tissue converting waste drive tissue machine carbon intensity
Focus on waste energy cost: tissue machine GJ/FMT is 10-20X2 converting GJ/FMT
Scope 3: NA Emissions Curve: Fibre – Raw Materials Cradle-to-Gate
Integrated fibre mills have clear low carbon advantage. TAD and other advanced processes have reduced grammage effect not shown as units per ton
Observations: current mood of climate frustration – it’s going to take a lot more money and time than first estimates
Lots of Hype, and Now Reality Sets in:
Pandemic effects and economic realities of 2023
Inflation and interest rate effects on cost of alternatives
Energy upset due to war in Europe
Eliminating energy sources before alternatives are available
EV cost and performance
Supply chain stresses
Politics, budget issues and citizen fatigue
Coal plant additions in India and China.
My reasons for long-term optimism:
Better visibility of the real issues is developing
Energy companies carbon removal and sequestration: Prove it.
We can now measure methane emissions from orbit
If the plan is for 2050, there is still time to make deliberate changes.
Acceptance of change and the need for adaptations will come.
New technologies need time to develop.
Magical thinking is being rejected.
After exhausting all other alternatives, we will do the right things.
Conclusions/recommendations
Carbon-free is the wrong word, but fossil fuel-free does exist, as shown by Essity. Less total carbon per year is the global climate goal, but the solution requires CO2/FMT metric. CO2/FMT is the process of carbon intensity – can we report progress on carbon intensity?
Carbon intensity includes: site location and local power grid carbon, site fuels, process energy efficiency and waste – less energy is less carbon, site configuration can make a big difference, integrated recycled fibre offers biofuel opportunities and lower Scope 3 carbon content, integrated virgin pulp can provide power, fuel, and lower Scope 3 carbon content.Hydrogen and on-site power storage are very expensive options at today’s costs. Newer, more productive tissue machines have lower carbon intensity. Improved technologies can reduce energy and carbon intensity. Elimination of tissue process variability and waste reduces carbon efficiency
It is going to be very interesting times for tissue makers!
The normalisation of global
conflict in a changing world order
Mark Goddard, Partner, Director, Secure Value
Conflict contagion: wars in Ukraine and Gaza are having a knock-on effect
Unequal fight.
“Democracies are very cumbersome and slow in their decisions, unfortunately. And because of this, they are constantly threatened by totalitarian regimes.”
“I think Ukraine is yesterday’s news” – war media cycle fatigue
“If the international order is not able to give us 100% guarantees to scare off and defend ourselves against a Russian attack… we have to be able to give ourselves the right to possess national nuclear weapons.” (Poland 2023)
Maersk diverts vessels away from the Red Sea.
British troops patrol Kosovo-Serbia border as tensions remain high
Real impact on global trade.
Most major carriers are rerouting away from the Suez Canal and the Red Sea to avoid the risk of Houthi attacks, despite increased security cover from the US and others. At the same time a severe drought has affected shipping levels in the Panama Canal. Shipping costs between Asia and Europe have already jumped and will increase further when re-routing via Africa.
Geopolitical weaponisation of supply routes – choke points
Black Sea – 22% of global grain supply.
Malacca Strait link between the Indian Ocean and South China Sea vulnerable
Northern Sea Route – 30% of Russian GDP dependent – China’s Belt and Road (B&R) investment – limited and highly politicised.
Suwalki Gap – NATO’s East European weak spot
Sanctions circumvention
The third-party problem: countering sanctions circumvention
The US has sanctioned Türkiye-based entities
it claims helped Russia’s war.
A year of elections: immigration a key issue
Eight of the 10 most populous countries in the world will hold elections in 2024. Short term appeal of populism.
NATO and EU enlargement
75th Anniversary NATO Summit Washington (July 2024).
Finland joined NATO in April 2023 (Sweden March 2024)
Four partner countries have declared they want to join, including Ukraine and Georgia.
The European Council decides to open accession negotiations with Ukraine and Moldova.
The European Council decides to grant candidate country status to Georgia.
NATO & EU expansion were cited by Russia as acts of aggression pre the annexation of Crimea in 2014.
Shifting global order: restructuring away from unipolarity
BRICs invites new members – Egypt, Ethiopia, Iran, Saudi Arabia, and the United Arab Emirates joined BRICS+ as new full member.
Russia’s 2024 BRICS+ Chairmanship began at the beginning of 2024.
Gulf Cooperation Council: Bahrain, Kuwait, Oman, Qatar, Saudi Arabia & UAE makes first foreign policy statement – on the war in Gaza.
Eurasian Economic Union signs.
Iran accesses a market of 190m in five member countries via the Eurasian Economic Union (EEAU) free trade agreement – 25 December 2023
Shifting global order
China’s Belt & Road initiative – 2023 is its 10th anniversary. More than 150 countries have signed up, including 18 of the EU’s 27 members. 24 February 2024: the two-year anniversary of Russia’s invasion of Ukraine
Compared to the first anniversary, the mood of optimism and unanimous support for Ukraine from the US, EU, and UK, was markedly more muted. The most significant change is the breakdown of bipartisan support in the US for financial and defence support. This has exposed the EU’s inability to match that support should it be permanently withdrawn (in terms of funding, procurement, and supply of crucial military supplies).
Momentum is currently in Russia’s favour, and Russia is making incremental territorial gains, albeit slowly, as its armed forces exploit wavering international support for Ukraine. This has resulted in military vulnerabilities, not least the lack of ammunition. Ukraine has also shifted tactics with some success, most recently in the Black Sea on 14 February 2024, when Ukraine successfully attacked a Russian warship off the coast of Crimea. This followed another successful attack on a large Russian landing craft in the same area in December 2023. Both attacks have effectively neutralised Russia’s ability to control the northern Black Sea.
Putin and the BRICS+:
the end of US unipolarity
Putin’s strategy of displacing the US as the dominant world power also lies behind Russia’s championing of Saudi Arabia and the UAE as members of the BRICS+ (they joined in January 2024). Both countries gave Putin a warm reception when he visited in 2020, and neither has supported sanctions against Russia over Ukraine.
Russia is openly pushing for change in the world order and this expansion of BRICS is part of Russia’s strategy to achieve that end. As well as rewarding Iran for military support by championing its entry to the grouping, an objective of the BRICS+ is a rebalancing of country representation on key international bodies, such as the UN Security Council. The admission of these countries is also a show of support by Russia for China—they are not aligned with the US and UK’s increasingly hawkish stance on China.
Before the war with Ukraine, it was believed that Putin was preparing to stand down in the face of declining popularity. However, the war, and particularly increased success on the battlefield in recent months, has restored Putin’s popularity back to mid-2010s levels. His legacy among Russians would also be significantly damaged if he stood down without concluding the conflict — they contrast this with a perception that UK Prime Minister David Cameron did not take responsibility when he lost the Brexit vote.
The rhetoric in the run up to the elections will increasingly contrast Putin holding elections to President Zelenskyy, who has overruled Ukraine’s constitution by cancelling elections, which were due by 31 March 2024. The Kremlin’s core message will be that Putin encourages elections, whereas Zelenskyy has established himself as a dictator.
The economy
The war in Ukraine will entrench a greater dominance of the Russian state over the economy. The government is preparing for a long war in Ukraine, which will mean increasing taxes (this is not being acknowledged by the government) and introducing special measures in the economic sphere to meet targets that support the defence industry, such as directing production towards military hardware.
Sanctions will continue to prompt the Putin administration to impose new measures to circumvent them and strengthen economic policies to alleviate economic shocks, such as the parallel-imports scheme, which allows imports of goods without the permission of the intellectual property owner.
In this context, there has been a huge increase in Chinese imports, with logistics routes between the two countries now improved and better established. One example is procurement by Moscow City council: before the war 95% of municipal goods and services, such as lifts and escalators, came from Europe. These have now been replaced by Chinese substitutes. There has also been an increase in local production with business adapting to produce goods that were previously imported. The message the Kremlin is trying to convey is that, despite unprecedented levels of sanctions, the economy is doing fine.
In the long term, economic decoupling from the West will push Russia to take further steps towards shifting its supply chains to Asia, including building new energy infrastructure, and pursuing technological independence from Western countries via import substitution. However, this will take time and likely be hindered by a lack of investment and operational capacity.


, the looming recovery will be uneven in a post-Covid-19 market undergoing widespread change")

